


The Van Westendorp Method for Optimal Product Pricing
How these four simple survey questions can identify the ideal price that maximizes revenue without limiting market opportunity.

Pricing is hard. Set your price too high and you risk reducing overall revenue by turning away prospective customers. Set your price too low and you leave easy money on the table or, even worse, make customers question your product’s quality. So how do you find an optimal price that maximizes revenue without limiting opportunity?
The Van Westendorp method does exactly that — this weirdly-named survey template uses four simple survey questions to show you the optimal price that the largest percentage of your customers consider acceptable for your product.
The Van Westendorp survey is a fundamental method in pricing research that every product builder should know. Regardless of your technical ability, this guide will give you the knowledge needed to confidently find your optimal price using a Van Westendorp pricing study.
Let’s get started…

What is a Van Westendorp?
The Van Westendorp Price Sensitivity Meter is a survey format that measures your customers’ willingness to pay for your product by asking them four questions:
At what price would this product be so cheap that you would question its quality? [Too Cheap]
At what price would you consider the product to be a great value bargain? [Acceptably Cheap]
At what price does the product feel expensive but still within consideration? [Acceptably Expensive]
At what price would this product become too expensive to even consider? [Too Expensive]
Combining everyone’s answers into one line chart creates the Van Westendorp Graph, which can be used to identify the optimal price point and an overall range of acceptable prices for your product:

Before jumping into the details and technicalities of this graph, it’s important to understand two things:
Why these survey questions work for measuring willingness to pay.
How to interpret this graph and use it for making pricing decisions.
How Van Westendorp Surveys Measure Willingness To Pay
The goal for a VanW is to find the optimal price that generates the most revenue possible by balancing their willingness to pay with your asking price.
Unfortunately, hypothetical questions like “how much would you pay for this product?” tend to produce unreliable answers — a 2010 study found that people’s estimate of their willingness to pay for a public good was 3x higher when asked as a hypothetical question compared to their actual willingness to pay for the same product in a choice-based experiment that included simulated payment.
The Van Westendorp survey is considered best practice in pricing surveys because it mitigates this hypothetical bias by asking contextual questions about cheap and expensive pricing limitations rather than directly asking someone to imagine what they might pay. This gives people better context to realistically consider their price expectations.
How To Interpret the Van Westendorp Graph
The best way to understand how the Van Westendorp graph works is to look at just one line at a time. Let’s start by including only the answers from the Too Cheap question…

The horizontal axis shows the range of prices mentioned in respondents’ answers. The vertical axis shows the percentage of participants who said a price point was, in this case, too cheap. Therefore this line graph tells us that:
100% of people agreed that they’d question the quality of a Stanley Cup if it cost $1.
80% of people said that a price of $4 would be a signal of low product quality.
Only 20% of people said that $13 was too cheap to consider buying.
0% said that a $28 price tag would indicate low product quality.
Here’s how to see these insights in just this blue line:

The lines for Too Cheap and Acceptably Cheap always run from top-left to bottom-right. The Acceptably Expensive and Too Expensive lines run from bottom-left to top-right direction because they’re based on the opposite logic — ie. 0% of people said $1 was too expensive to consider.

Ok, so now you should be able to interpret what these lines mean, but what does the overall graph mean? The key insights from a Van Westendorp survey are found at the points where these four lines intersect…
(a) Optimal Price
In a Van Westendorp survey, the price where the lowest percentage of people said the product is Too Cheap or Too Expensive is called the Optimal Price. In the example below, only 3% of people said $26 is too cheap (blue) while another 3% of people said $26 is too expensive (red), which means that ~94% of people think $26 is a suitable price.

(b) Acceptable Range
The Acceptable Price Range is the gap between two points on this graph…
Point of Marginal Cheapness → where the Too Cheap and Acceptably Expensive lines intersect. Any price lower than this point would result in a higher percentage of customers thinking your product is too cheap to be of good quality than the percentage of customers who think that your product is a little expensive but still within consideration.
Point of Marginal Expensiveness → where the Acceptably Cheap and Too Expensive lines meet. If you set your price higher than this point, you’ll have more target customers who think your product is priced beyond consideration than the number of customers who think it is a bargain of great value.

Now that we know how to interpret Van Westendorp results from the line graph, I’ll explain how to gather this data in the first place…
How To Create A Van Westendorp Survey
A Van Westendorp is a survey template that you can run on whatever tool you’d like. The examples in this guide are from OpinionX because its free tier gives you unlimited surveys with unlimited participants (unlike almost every other survey tool which is capped at 10-50 responses on the free version). OpinionX also has a Number Response question type that only accepts numerical answers, which is ideal for VanW surveys because it means you won’t have to manually clean up your data afterward.
To start, I’ll add four Number Response questions to my OpinionX survey using the Van Westendorp template:
At what price would [this product] be so cheap that you would question its quality?
At what price would you consider [this product] to be a great value bargain?
At what price does [this product] begin to feel expensive but still within consideration?
At what price would [this product] become too expensive to even consider?
Below is an example of how I put these survey questions into my Van Westendorp survey on OpinionX:
^ Try this survey for yourself here.
How To Create A Van Westendorp Results Graph
Turning your survey results into a Van Westendorp graph is much easier than you might expect! In fact, I have made a free spreadsheet template for you that automatically turn your survey results into the VanW line graph. The best part is that you can even connect this sheet directly to OpinionX so that the results update in real-time whenever someone new completes your survey!
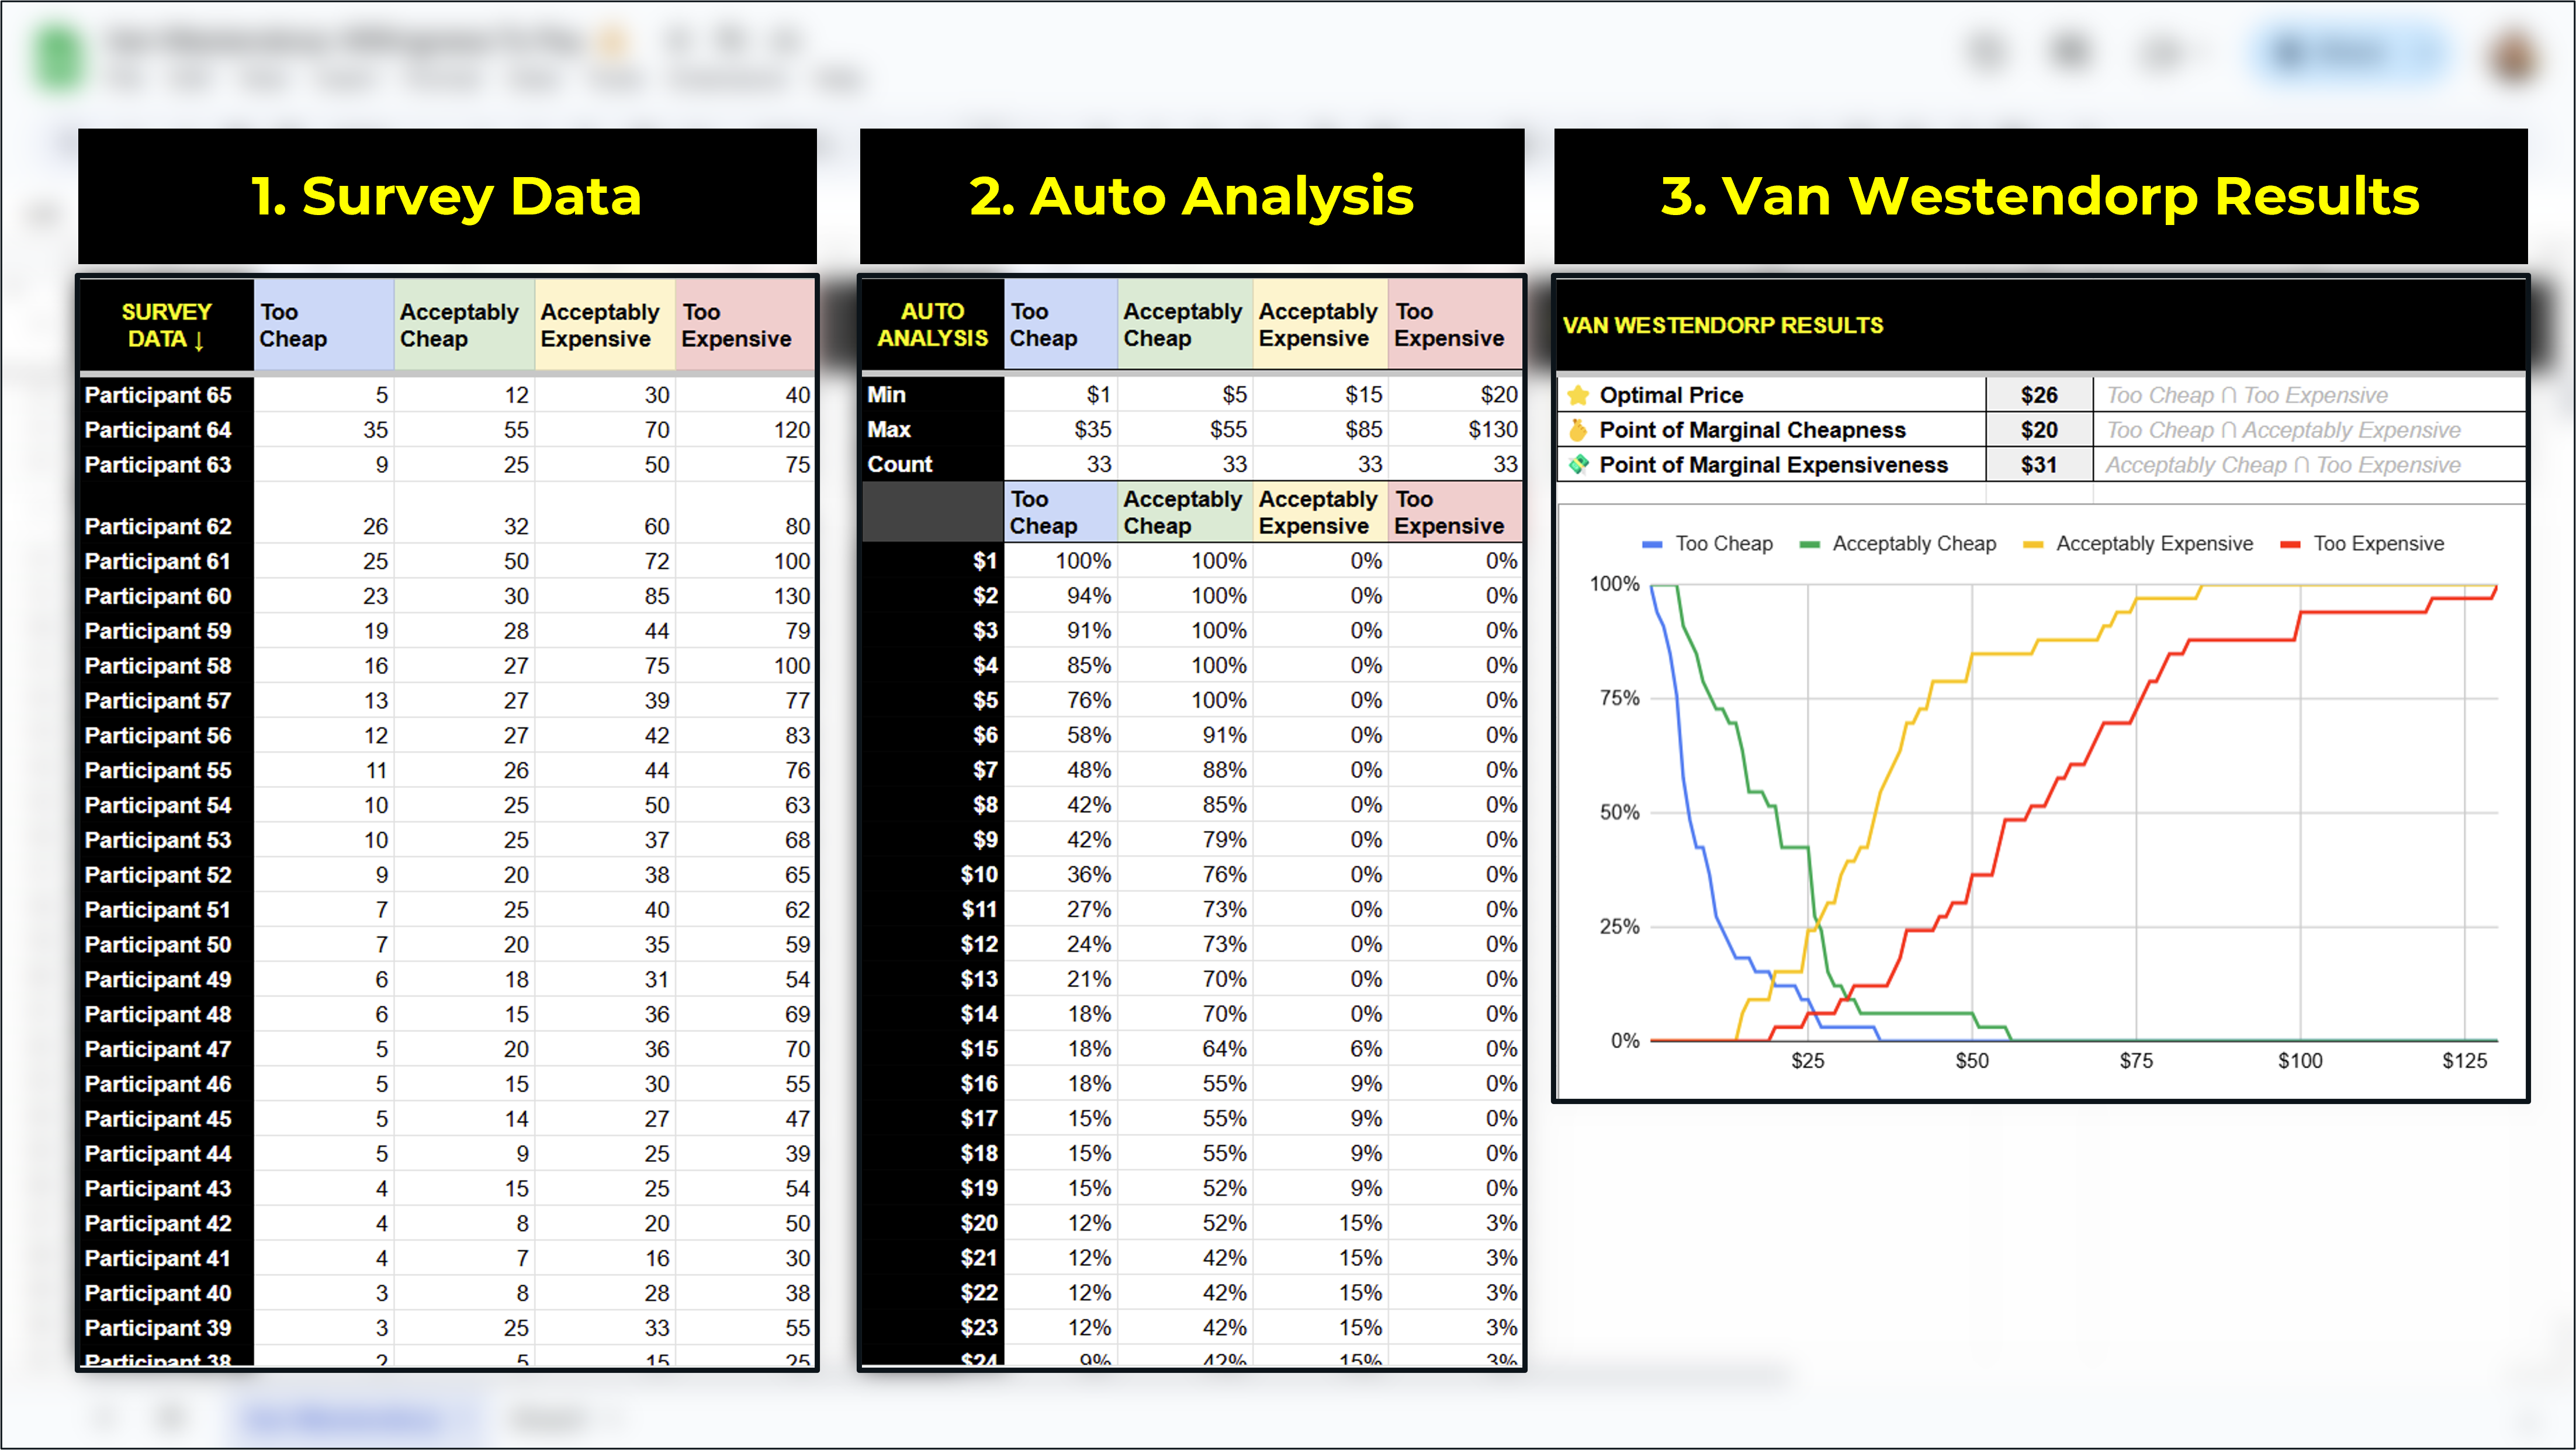
Here’s what the Van Westendorp results template looks like on Google Sheets:

This free Van Westendorp analysis template has three main sections:
Survey Data → Link this to your OpinionX survey for real-time updates or manually copy/paste your data here once your survey is complete.
Auto Analysis → This section automatically turns your survey responses into the format required for creating a Van Westendorp line chart.
VanW Results → The line chart populates automatically and the three key numbers are identified for your Optimal Price and Acceptable Range.
There are two ways to get results into this spreadsheet:
Connect your survey to Google Sheets so that the results update automatically anytime someone new completes the survey.
Export your results, clean the data manually, structure it in the correct format, and then copy/paste it into the template.
The copy/paste approach does not require any explanation. Once you copy/paste your results in using the right format, the template will update automatically, like this:

You can connect your OpinionX survey to this GSheets template to create a real-time Van Westendorp dashboard. To do this, open the Export menu on your OpinionX survey and link your survey to Google Sheets by clicking the “Connect” button:

Once you complete the Google Sheets connection process, your browser will open up a second tab with your survey results in an unedited state like this:
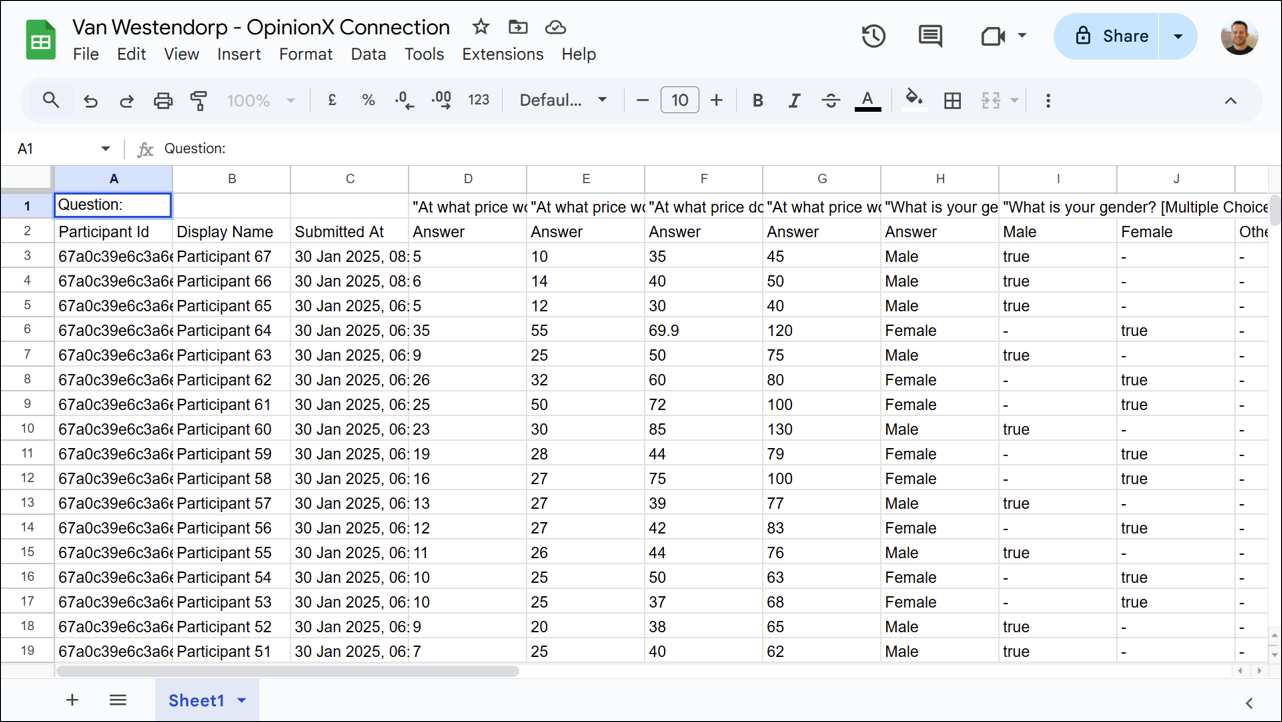
You don’t need to change anything here (I even recommend leaving the tab name as “Sheet1”, as the formulas are designed specifically to pick this up and require minimal customization). Instead, open the template in a new window, click Make A Copy → Existing Spreadsheet, and search for the name of your OpinionX survey.

Once you do this, the template will appear as a second tab alongside your real-time survey results and will scan that “Sheet1” tab, automatically populating the analysis dashboard right from the get go!
Some things to note about this spreadsheet template:
It’s a view-only doc. To make your own editable copy, click File → Make a copy.
The spreadsheet includes two tabs, one with the dashboard and the other with example survey data.
If you reuse this spreadsheet template elsewhere, please attribute credit to this guide as the original source.
Access the template on Google Sheets here:
→ Free Spreadsheet Template for Van Westendorp Surveys ←

What are the Pros & Cons of Van Westendorp for Pricing Research
Some factors to consider before jumping into your first Van Westendorp project…
Advantages
1. Easy Setup → You don’t need to learn any advanced survey methodology. The Van Westendorp method requires just four simple number response questions and can be included in any normal survey along with other questions.
2. Easy to Complete → Van Westendorp surveys are so simple that even kids can complete them. According to Brian Balfour (founder of Reforge, the top professional development program in tech), the Van Westendorp method reduces the usual bias found in stated preference surveys “because it’s not a single question about a single point, but a number of questions that help you triangulate somebody’s true willingness to pay.”
3. Easy To Analyze → Anyone can turn their survey data into a VanW line graph using a simple spreadsheet template and then identify their optimal price from that graph without requiring any background in math or data science.
4. Easy To Understand → The optimal price is where the highest percentage of target customers say the product is neither too cheap nor too expensive — this is easy for anyone to understand and it intuitively makes sense why this would be valuable as the primary output from a pricing study.
Disadvantages
1. Assumed Intersection → Van Westendorp graphs on Google Images always show an intersection occurring between the too cheap and too expensive lines. This is not guaranteed! An intersection between these lines often occurs based on the answers of a small minority of respondents (which in itself could be considered a disadvantage of the VW method too). Surveys with a low number of participants have a higher chance of no intersection occurring. However, if your VanW survey ends up with no Too Cheap/Expensive intersection, you can still assume an optimal price within the range between the Too Cheap hitting 0% and Too Expensive leaving 0%.
2. Complex Bundling → Respondents are better able to accurately consider their price expectations for a single product offering shown in isolation, whether this is your overall product or one specific feature. If you want to conduct a pricing study for a bundled product offer (ie. many products put together into one offer) or a complex offering made of many features (like a pricing tier on a SaaS product), you should consider running a conjoint analysis survey instead. Conjoint analysis is also a popular pricing research method because it is a multi-variable ranking method — it lets you measure how product attributes (like price, brand, and size) influence customers’ purchase decisions while at the same time ranking the options within each attribute group (eg. small, medium, large for the ‘size’ category). Conjoint also comes with some reporting formats that are purpose-built for pricing studies, like Marginal Willingness To Pay analysis and Market Simulators.
Parting Advice
Two things to consider including in your survey alongside the four Van Westendorp questions:
(i) Segmentation
In what ways will you want to filter your results afterwards? A good Van Westendorp study does not just look at the overall results, it identifies which customer segment is willing to pay the most for your product.
Consider before launching your survey what ways you will want to filter or compare your results — a good starting point is to think about demographics (age, gender), firmographics (company size, department), or geographics (continent, city). Then plan ahead to have this data available during analysis, either by importing this data or by including some simple multiple-choice questions in your survey to collect it. For example, I always like to compare free users versus paying customers for any survey I run with my own userbase.
Once you’ve got this data, you can filter or compare these groups in one click using OpinionX’s segmentation features. You can also define more complex segments using logical expressions, like filtering your results to include only Enterprise tier customers in Canada working in Product Management. Once a filter is applied, any exported data will match your segmentation configuration, making it an easy way to tailor the data you will paste into the spreadsheet template.

(ii) Identifiers
Once you have identified segments with the highest willingness to pay, you’ll want to be able to understand why those customers are willing to spend so much more. Having identifier data associated with participants — either by asking for a name/email in your survey or by importing data from your CRM — will allow you to invite hand-picked survey respondents to follow-up in-depth interviews.
Create your own Van Westendorp survey on OpinionX today for free with unlimited participants. OpinionX is used by tens of thousands of companies for customer research, ranking user preferences, and conducting pricing studies like VanW and Willingness To Pay surveys.
This is the first in a series of pricing research guides I’ll be posting over the coming weeks. What other pricing research methods would you like to see covered? Have you tried making a Van Westendorp survey before? Do you feel like you’re more likely to try one now? Keen to hear what you think :)
Daniel